
What you don't see
has a cost, too.
Choose your sector. Find the blind spot.
You price in the dark.
The claim reveals the cost.
An area average can hide the actual risk of each asset.
- Premiums that don't cover the risk
- Repeated loss assessments
- Disputed claims payments
Conceptual diagram · illustrative positions
Underwrite and resolve claims with each asset's history and events.
Territorial evidence that complements your risk models.
One engine.
Every risk.
The entire cycle.
From the first signal to the next decision. The territory connects every stage.
What could happen?
The history of a place puts risk in context.
The present is
only part
of the story.
To understand risk, look further back. We connect satellite observations, weather and history to understand what a place has experienced.
From history to evidence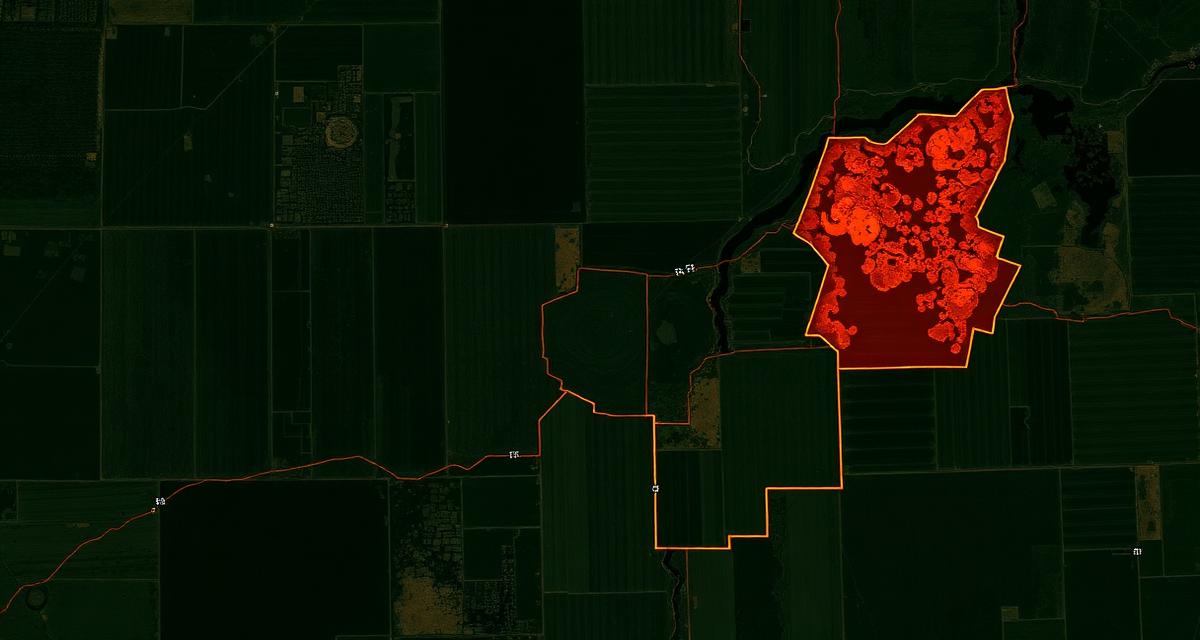
A long-term perspective
40years
One territory.
Decades of observations.
A history to reconstruct.
From physical data.
To a decision
you can explain.
Every conclusion preserves the path to its source: what we observed, what we calculated and what still needs verification.
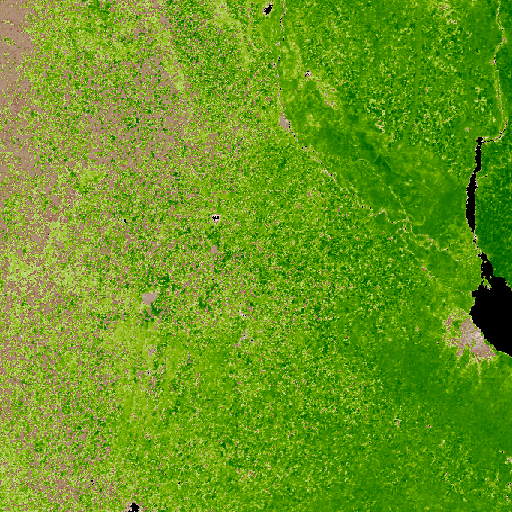
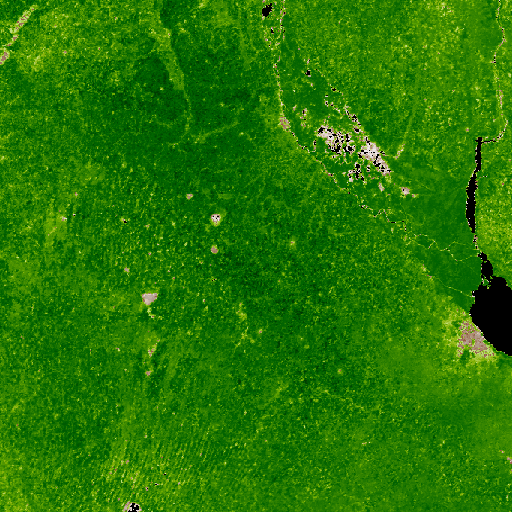 BeforeAfter
Slide to compare observations.
Observe
Optical imagery, radar and environmental variables. Each source with its date and coverage.
Source + time + locationReconstruct
Connect signals, detect changes and reconstruct events on the ground.
Variables → eventsSupport the decision
Traceable evidence with its methods, uncertainty and limitations. Ready for review.
Evidence + traceabilityWhat is observed, calculated and verified.
Always distinct. Always traceable.
One territory.
Many decisions.
From initial analysis to claim resolution. Physical context supports the entire insurance cycle.
Before
During
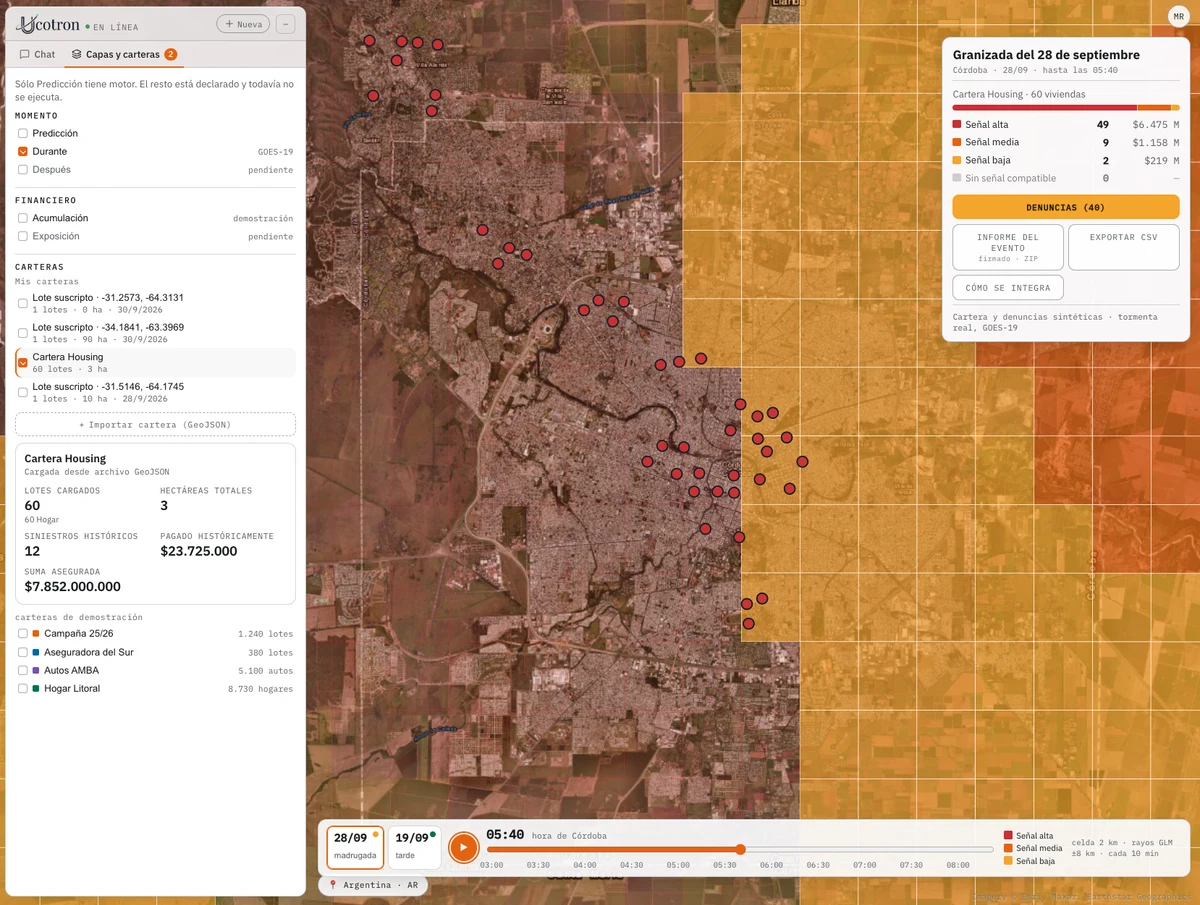
After
From the territory
to what you need to know.
A location, a portfolio or an event. Different perspectives to decide with the full context.
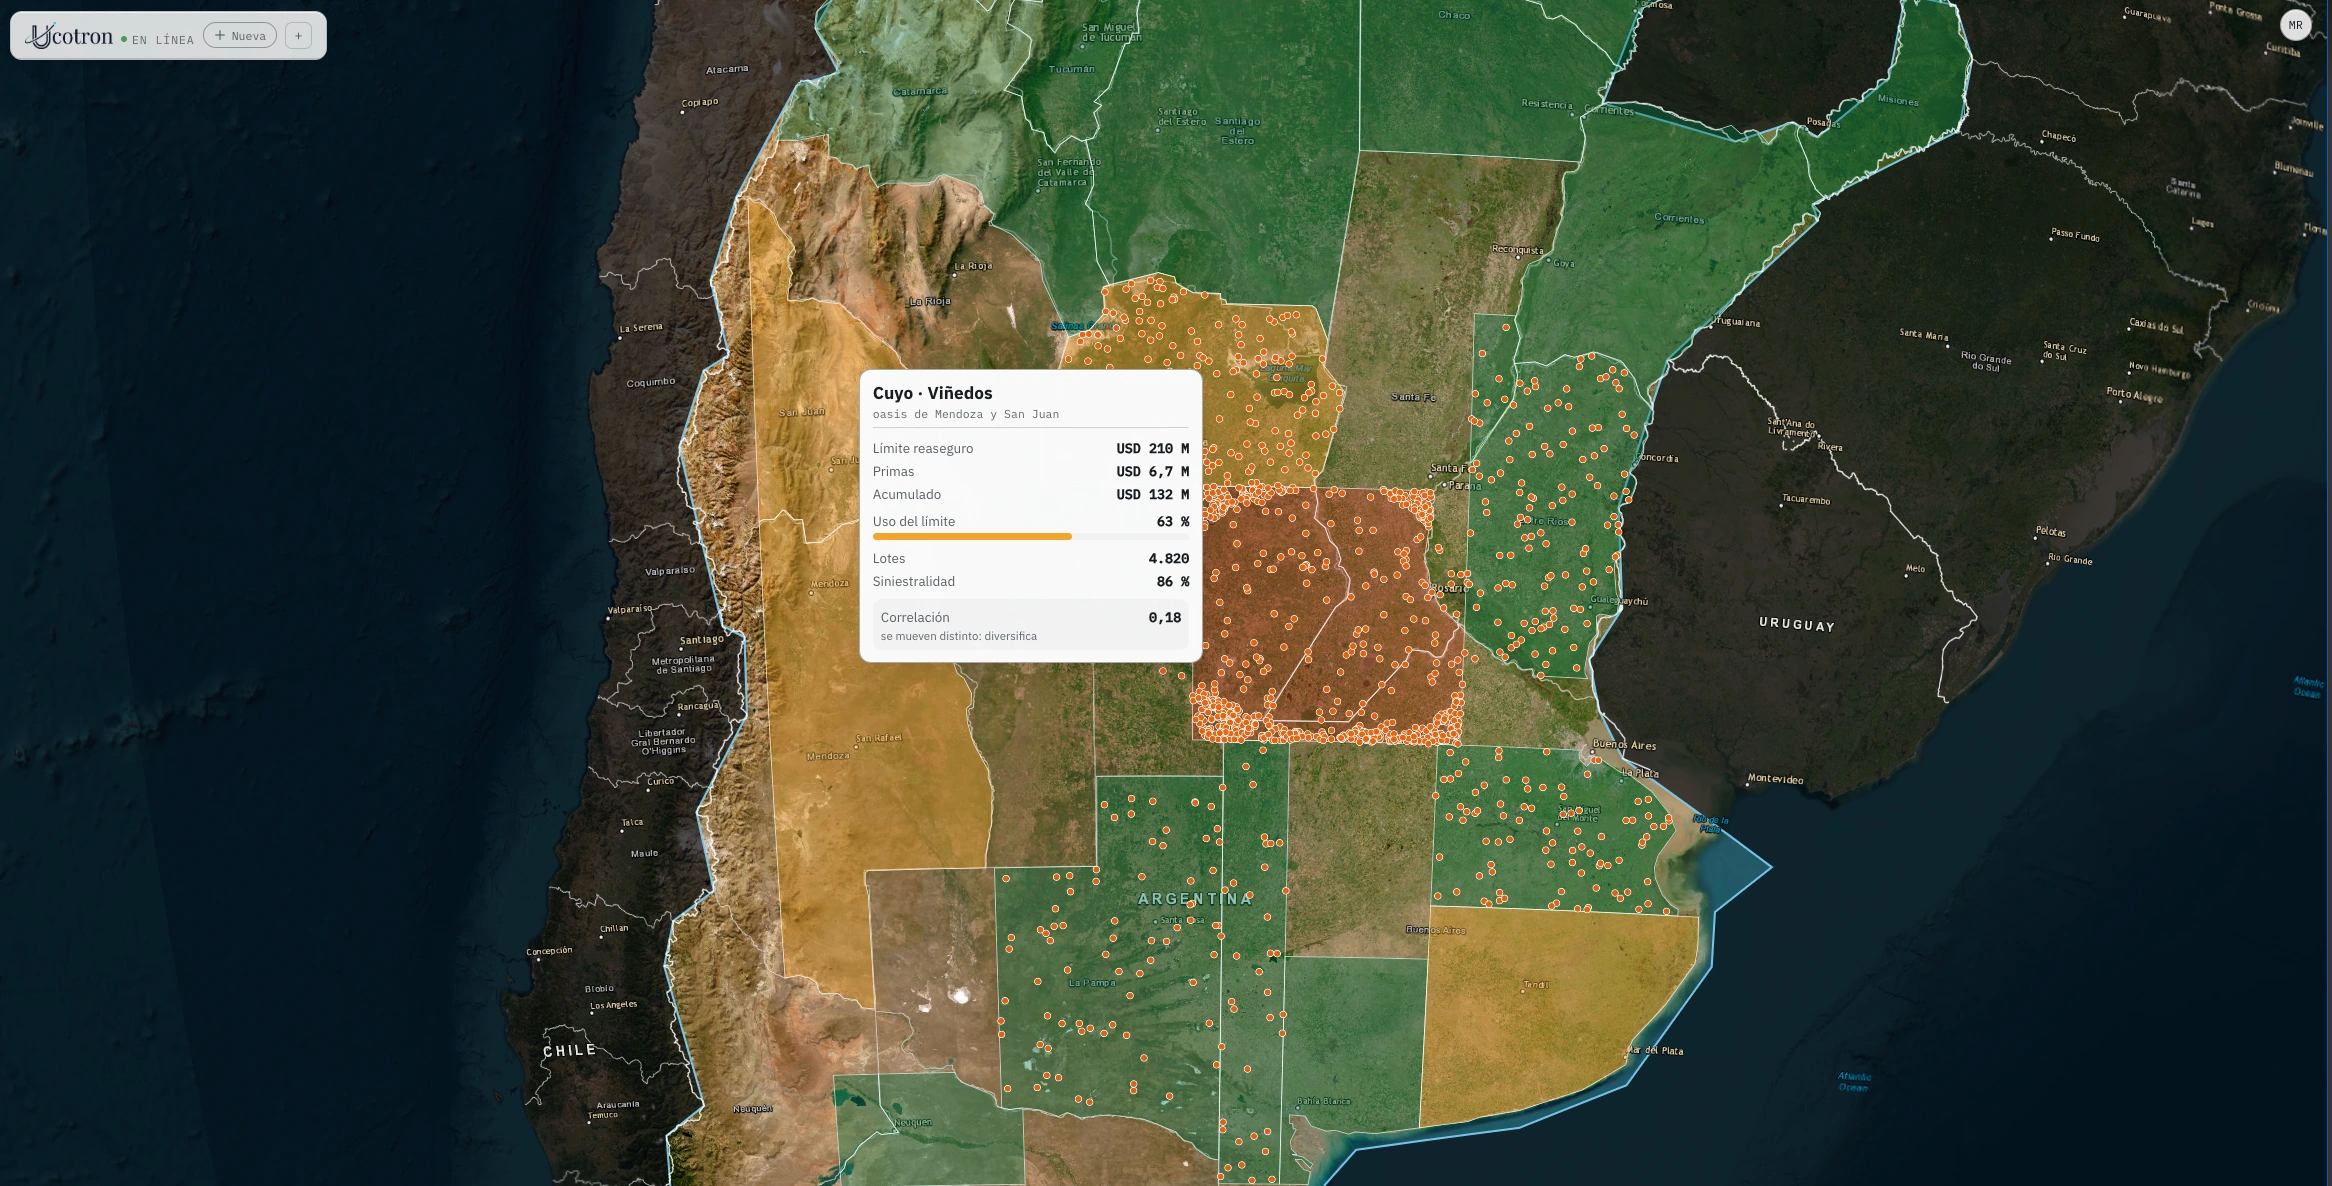
Many assets. One shared event.
See where your portfolio is concentrated and which locations share the same risk.
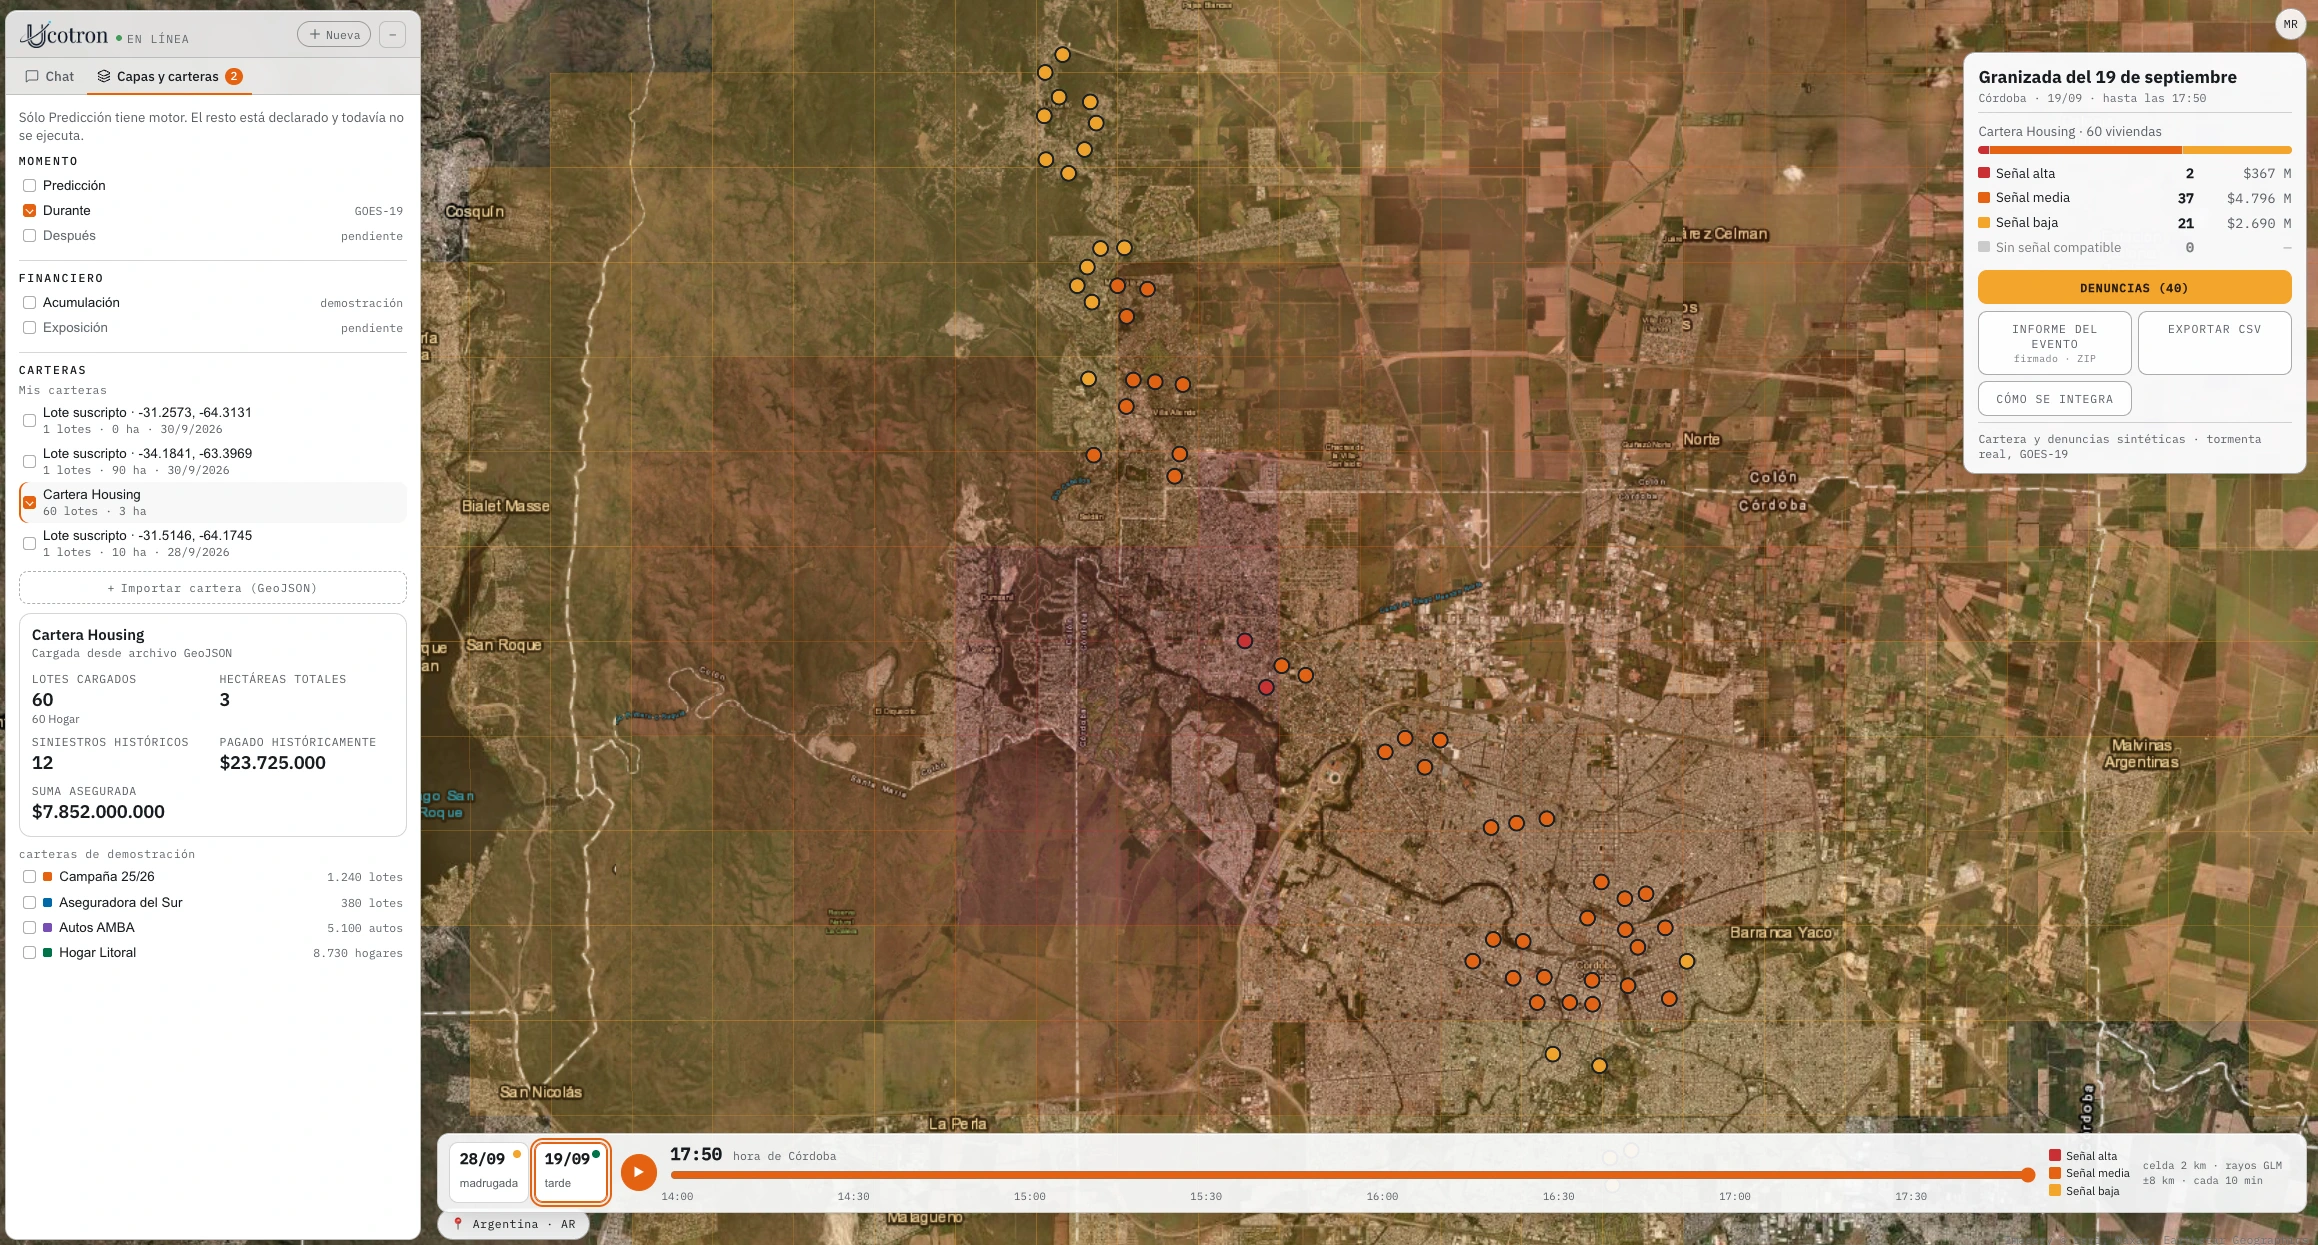
Overlay the footprint on your portfolio.
Connect assets and events to understand what is exposed and where to focus your review.
Did lightning strike there?
Check the location and date against the available evidence of lightning activity.
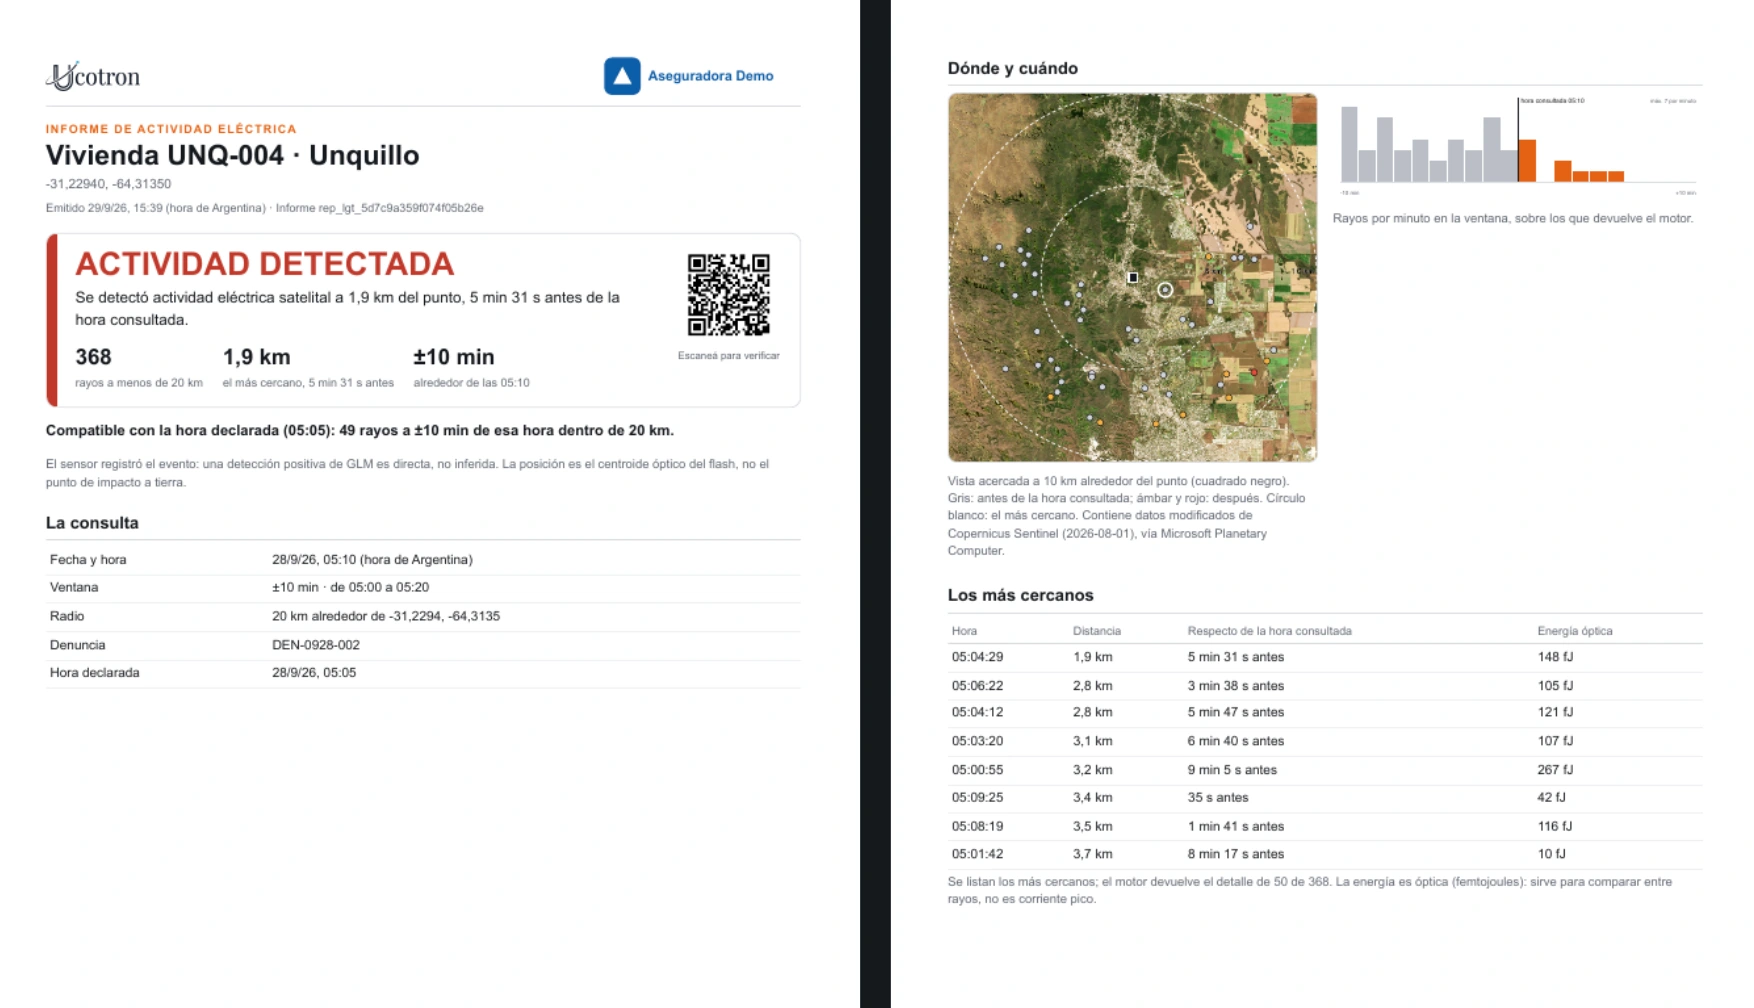
The past informs the decision.
Read climate, vegetation and soil in context. Find recurring patterns hidden by averages.
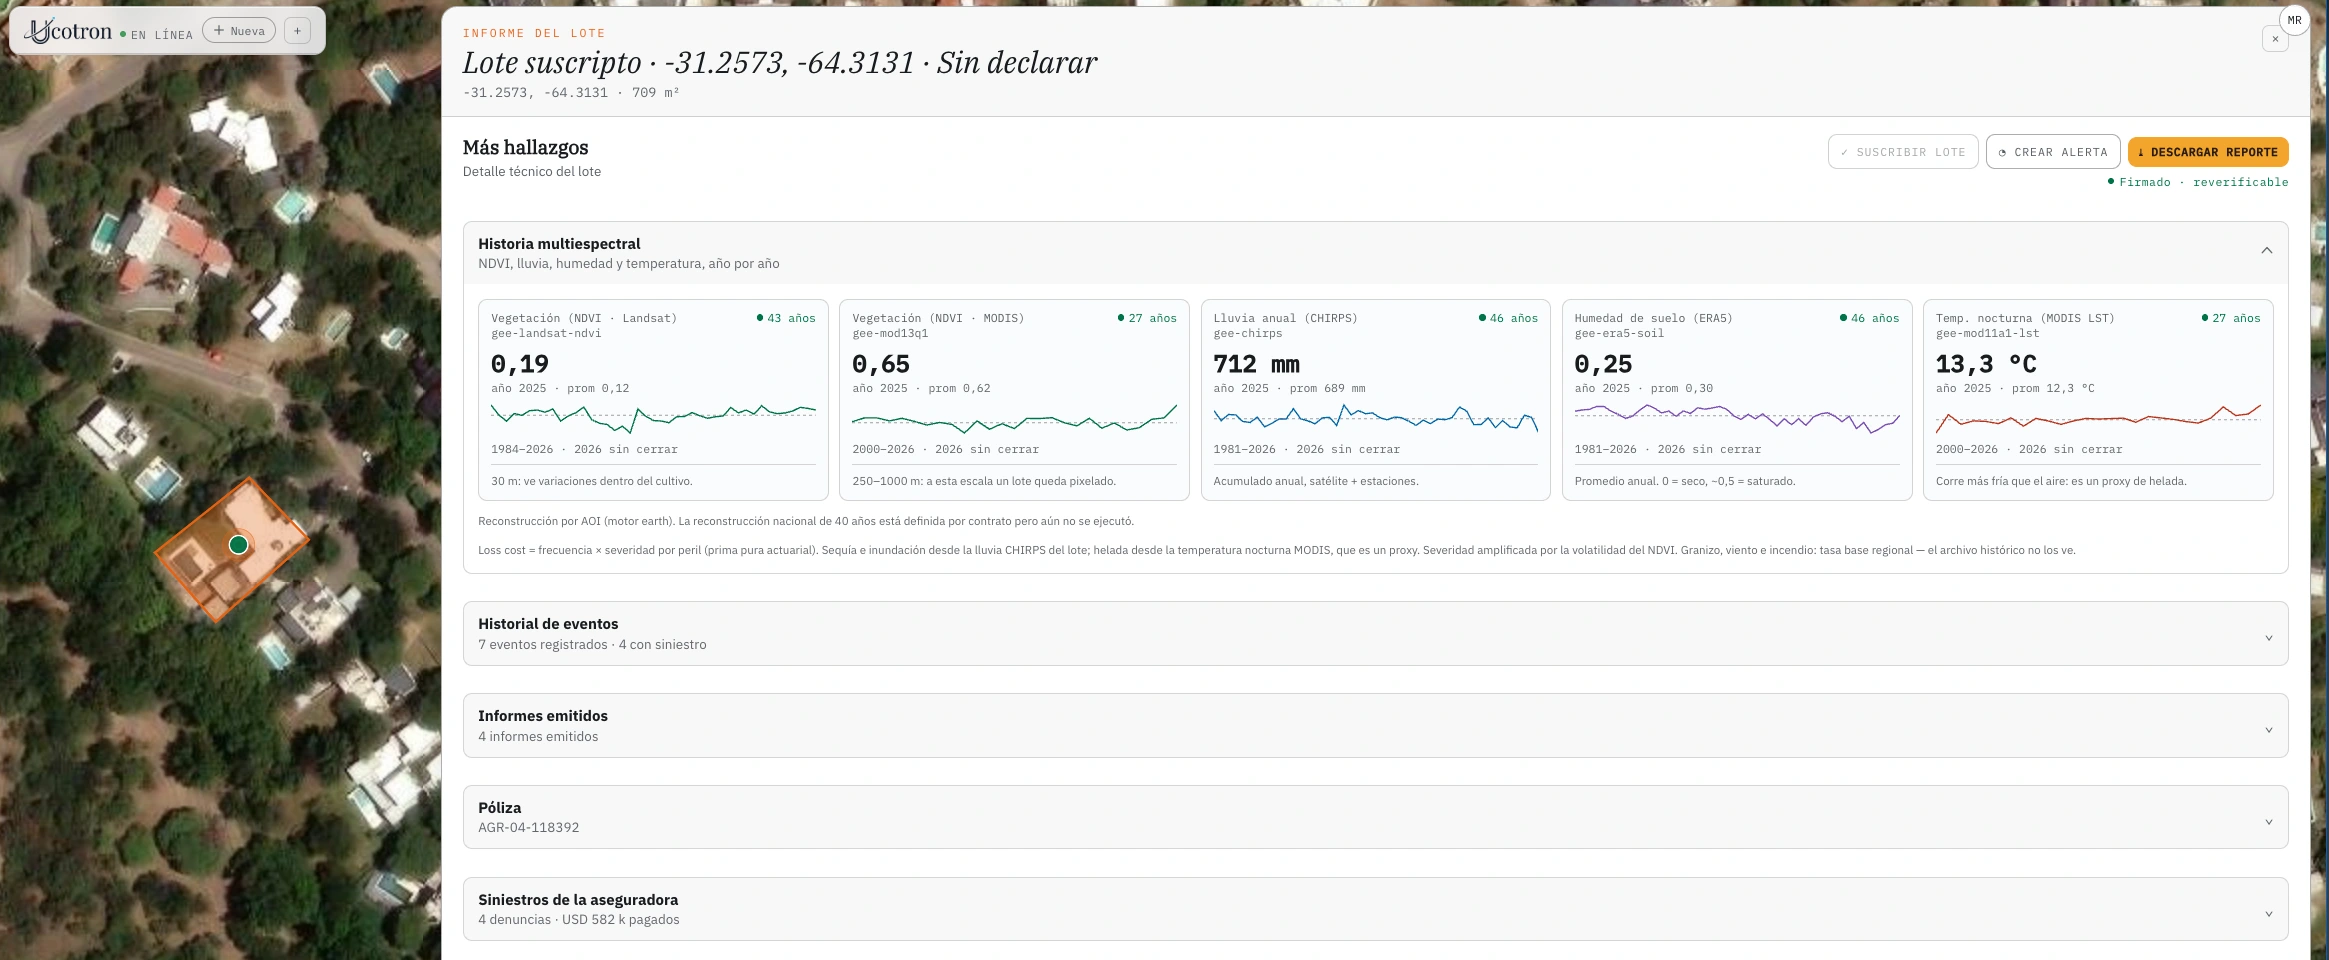
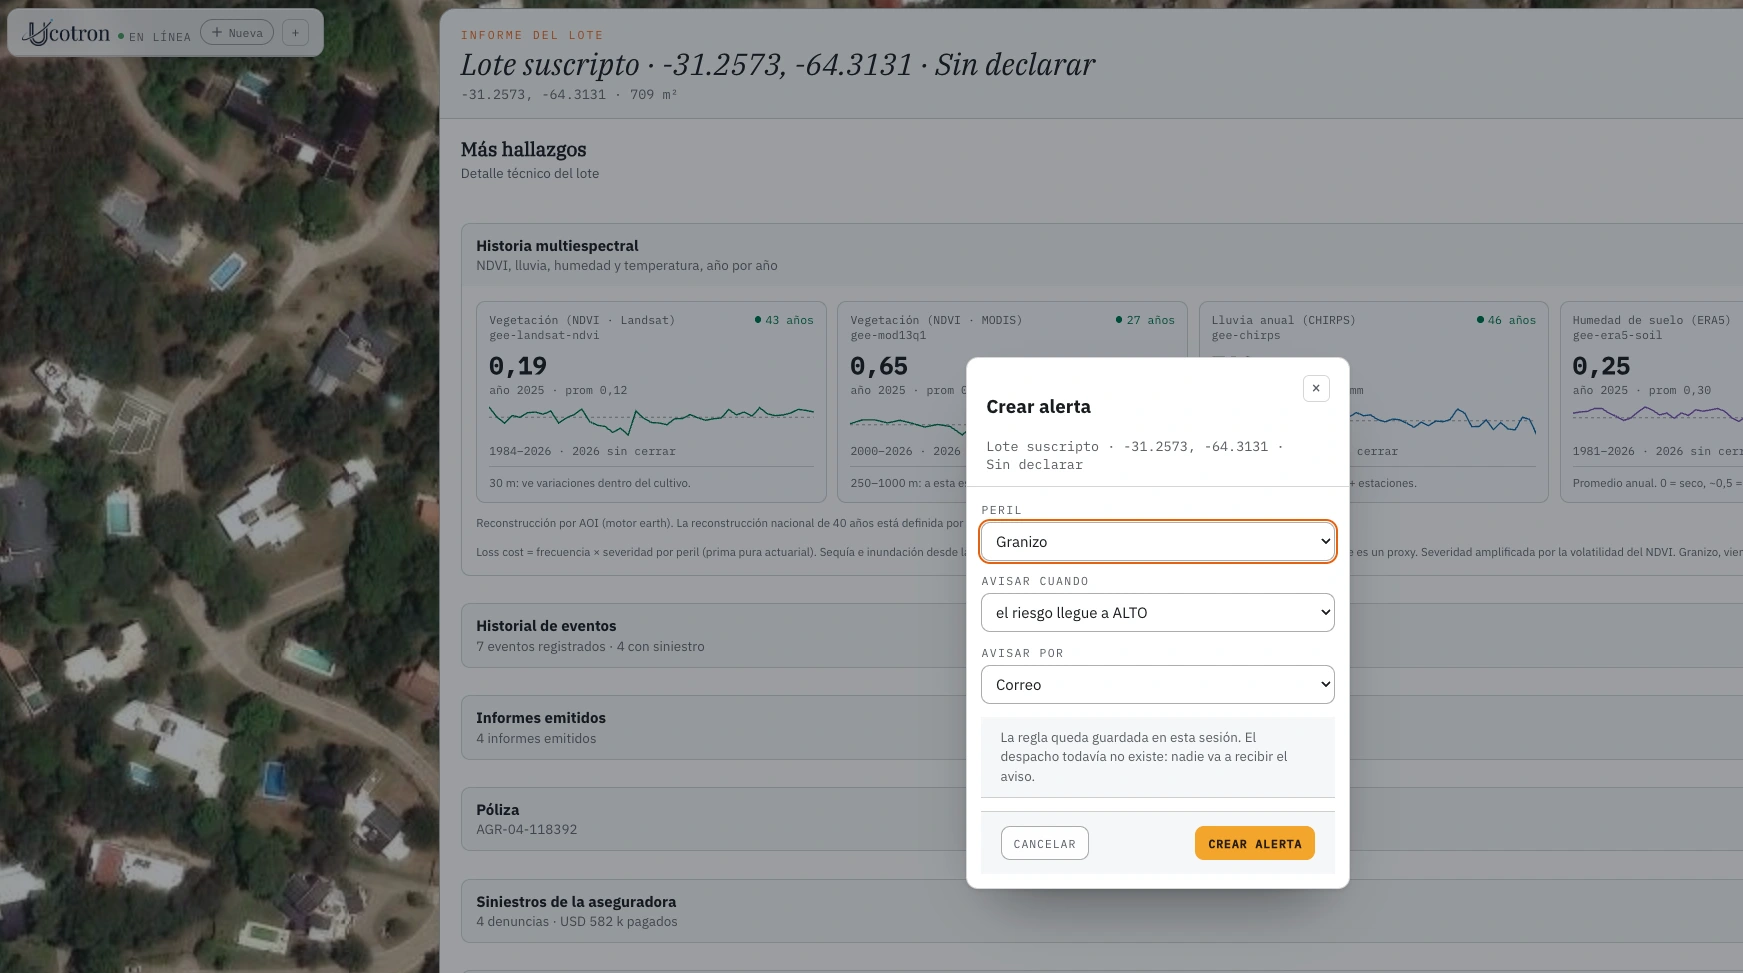
Follow what changes.
Track how the territory and the event evolve to guide your next step.
A conclusion backed by evidence.
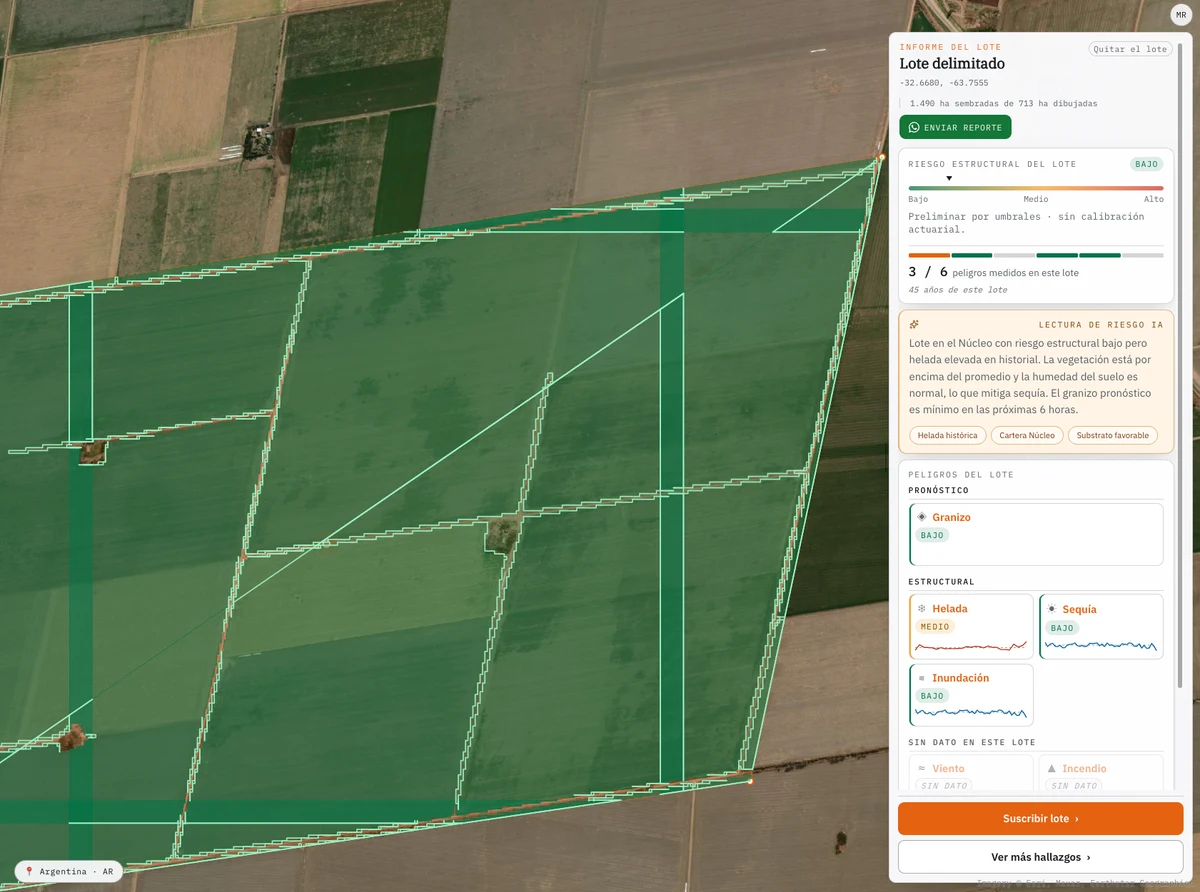
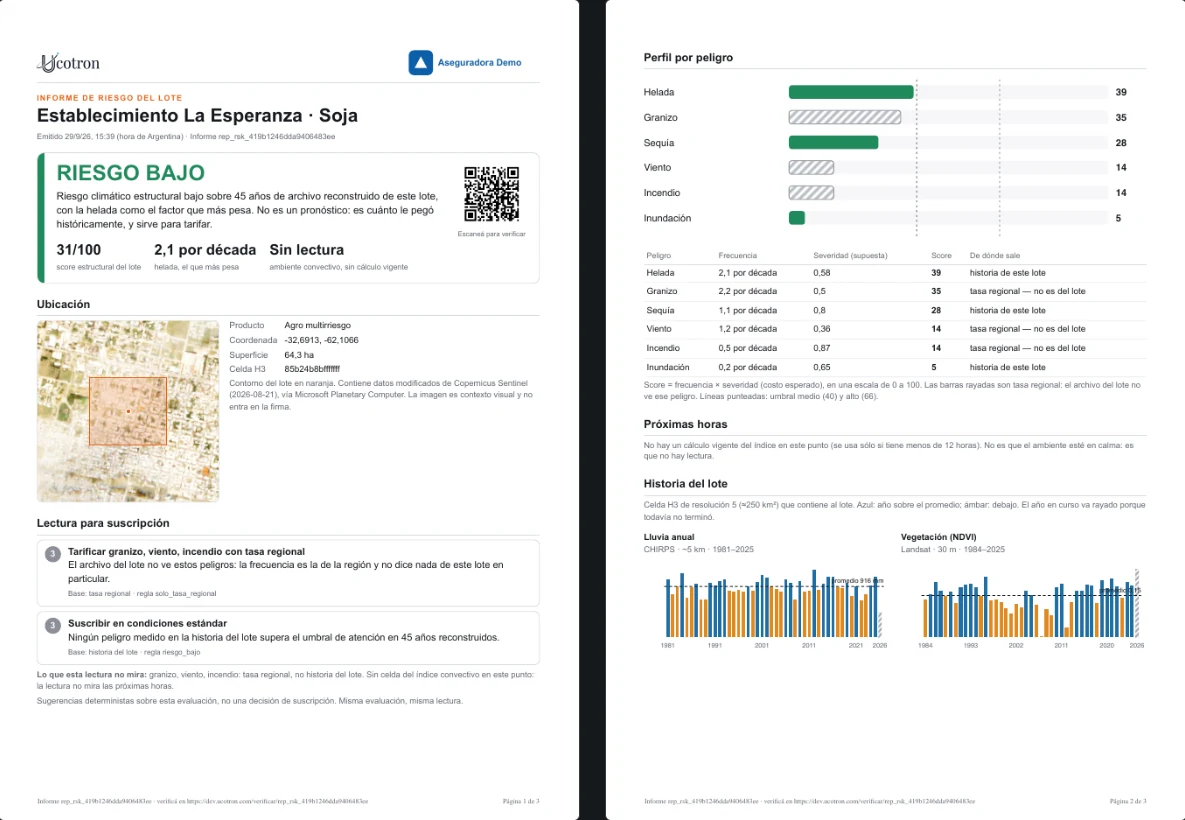
Share findings with their sources, method and limitations. Evidence ready for review.
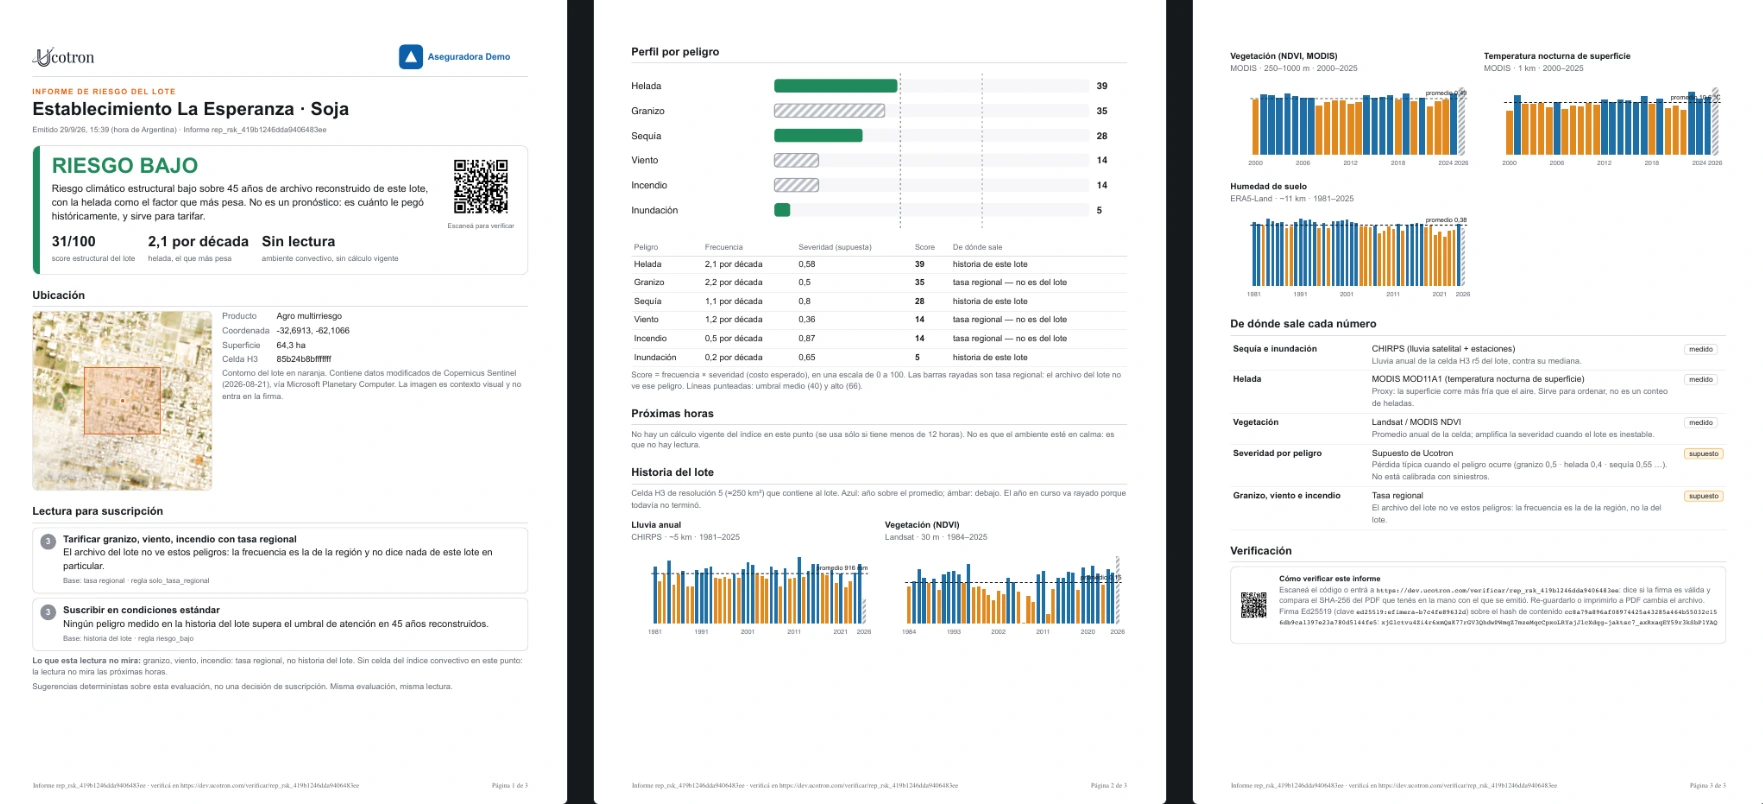
Cortex and report screenshots. Select an image to see the details.
Reach the engine where you already work. Or make it part of your own.
Three ways to use the same engine: where your team already talks, in your technical stack, or embedded inside your own product.
 ENGINE



What if you had seen
the risk sooner?
Revisit your portfolio decisions. With your policies and claims, we reconstruct the missing context.
You bring the history.
Policies, locations and claims. We agree on a period and work under NDA.
We connect it to the territory.
We reconstruct events and each asset’s exposure using the available evidence.
You leave with a diagnosis.
Where to review pricing, which signals to watch earlier and which inspections to prioritize.
Let’s talk first. No commitment.
Potential financial impact
USD 41MOver ten years of a synthetic portfolio.These figures illustrate the example, not a promised result. Your diagnosis comes from analyzing your own data.
Part of the region's insurtech ecosystem.